On the Sakinorva Cognitive Function Test Dataset, Its Analysis, and the Future
2023/6/30 16:09
Since the Sakinorva Cognitive Function Test was first launched in April 2018, approximately 5.2 million rows of test results have been collected from over 3 million users who have opted in to share their test data. This data, combined with all the generous feedback I’ve received over the years, has allowed me to make improvements to the test over time, none of which would have been possible without your help. I would also like to extend my gratitude to the several million people who have taken the test and helped share it around. I greatly appreciate all the support I have received over the course of these past few years.
Having now amassed over 300,000 rows of new data, I would like to expand in detail what specific changes the test had underwent in its new iteration, and what conclusions I have gathered from the data collected since the test was last updated.
Veteran test takers may have already taken notice of one major change: the visual appearance of the test. From January to February 2023, the website as a whole underwent major infrastructure changes. The website now utilizes template files and a panel-based layout to streamline server-side processing and improve user experience. The test was updated in late April to match the new layout. With the new template system came a number of changes to the server side code.
Question data (including translation data) is no longer retrieved from a relational database; relational databases are now only used in collecting test data, and users are only able to connect to them by fulfilling the prerequisite criteria for consenting to data collection, decreasing instances of database overload. Less data is transferred to the end user overall, and the transition to using a flat file database for the question pool has effectively eliminated page hanging when initially loading the test.
While several changes have been made to the result algorithms over time, in the newest iteration of the test, two major changes have been introduced: the “axis-based” algorithm has been brought back, and the “Myers letter type” formula has been updated once again.
The “Myers letter type” formula attempts to mirror Isabel Myers’ theory about the eight letters of personality, scoring each question along each letter and comparing them with their complementary preferences to create a four-letter type. Its original purpose was to demonstrate that Myers’ theory is fundamentally distinct from what personality typology enthusiasts commonly refer to as the “cognitive functions,” which Myers herself referred to as “type dynamics.”
Since the last major update to the test in May 2020, the test has employed a “relative” approach to determining a “Myers letter type,” placing test takers’ results along eight different bell curves (by generating z-scores based on a particular average and standard deviation). In the past, however, these bell curves were generated from simulated data, as there was no relevant data available to work with at the time.
For reference, these simulated z-score values are the following (rounded to the nearest thousandth):
| Letter | µ | σ |
|---|---|---|
| E | -1.334 | 8.961 |
| N | -0.676 | 13.080 |
| F | -1.628 | 17.270 |
| P* | -2.047 - 6 | 8.971 |
| I | 3.221 | 8.971 |
| S | 4.813 | 13.000 |
| T | 4.891 | 16.091 |
| J | 2.883 | 10.278 |
* P has been offset by -6 points.
The most common complaint about this test throughout its history has been its “intuitive bias.“ “Intuitive bias” here references an inveterate disposition found commonly throughout personality typology communities of favoring intuition over sensation, believing intuitive types to be smarter, more creative, and more complex, thus leading to a large-scale ”mistyping” of people who would otherwise be typed as sensers. To understand how this idea may apply to this test, a brief retrospective may be necessary for context.
Very few test takers are aware of this test’s origins; it was originally created in jest to poke fun of people employing the cognitive functions to figure out their “MBTI” (a registered trademark that this test does not have anything to do with). Typology enthusiasts generally favored the cognitive functions for their insight into personality, and this test sought to turn the tables by demonstrating two things: that the cognitive functions were not synonymous with Myers’ letter preferences, and that Myers’ letters could also be used to create a type with its own insights.
When I manually scored the test, my own insights and biases about the nature of these four-letter types undoubtedly played a role in how questions would lean in their preferences. At the time, I believed that Myers’ eight letters were not independent personality preferences but instead a set of arbitrarily defined personality “ideas” that overlap when applied to people. You can read more about it here. But because of this, most questions lean in the directions of ENFP or ISTJ. While I think the idea was rather novel, I had to make major revisions to how strongly these “auxiliary” preferences would impact the questions due to accusations of “intuitive bias.”
I do think what people were calling “intuitive bias” was indeed bias of a particular kind, but I believe it was misdiagnosed due to the lack of information available on the outside. What was being called out as “intuitive bias” was, I believe, simply a bias for putting N together with P and S together with J. Opportunities to score N but not P, P but not N, S but not J, and J but not S are rare on this test. I simply was unable to see a way to separate these letters based on the questions I provided, but I tried hard to contrive NJ and SP out of what I had to work with.
The relative method of scoring tests does not altogether solve this problem, but it theoretically does split users evenly across the two axes… provided that the bell curves used by the test are based on real user data, which they had not been. Instead, thousands of simulations were run on the test with random answers, thus creating the set of means and standard deviations displayed above. The averages observed are therefore generated from random data. You may notice that an offset was used in the P mean to shift all scores more toward J. But why not for N? E? Or F?
Here is more opportunity for bias: it was my personal belief then that people taking the test are generally more N, P, and I (in that order of preference) than the general population. In my efforts to allow more opportunities to score only one of either N or P, I offset what I believed to be the weaker of the two preferences among test takers to allow more room for results with an N and a J in them (as opposed to with an S and a P).
Now, however, two million rows of data were processed to provide these new z-score values:
| Letter | µ | σ |
|---|---|---|
| E | -7.869 | 12.991 |
| N | 14.409 | 18.746 |
| F | -4.127 | 24.898 |
| P | 9.033 | 11.524 |
| I | 11.186 | 13.801 |
| S | -2.877 | 17.733 |
| T | 18.545 | 21.868 |
| J | -3.165 | 13.412 |
With a genuine “relative” formula now being applied in this scoring method, test takers’ results take on a new meaning. The type given by the “Myers letter type” formula is not a type, but an combined set of four letters that represent how much more you lean toward your given preferences compared to the average test taker.
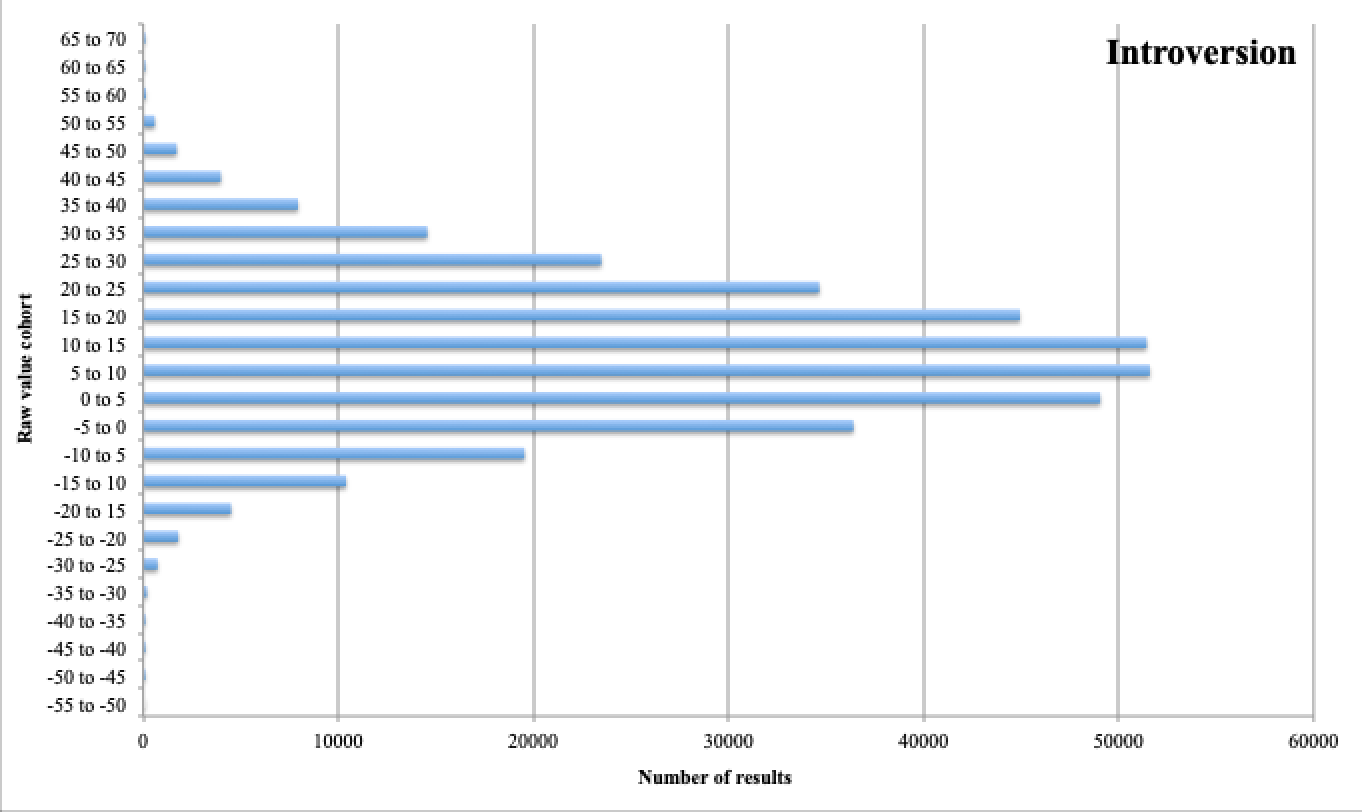
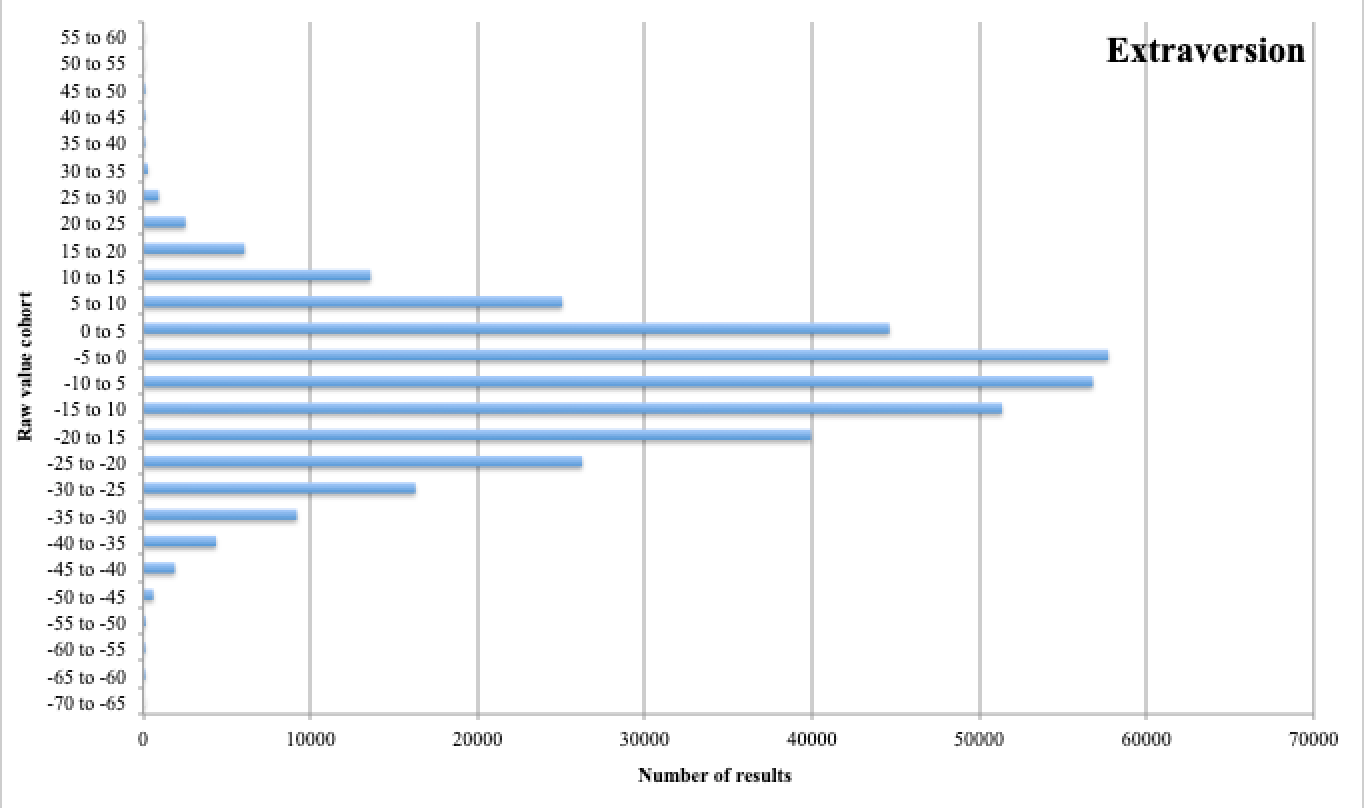
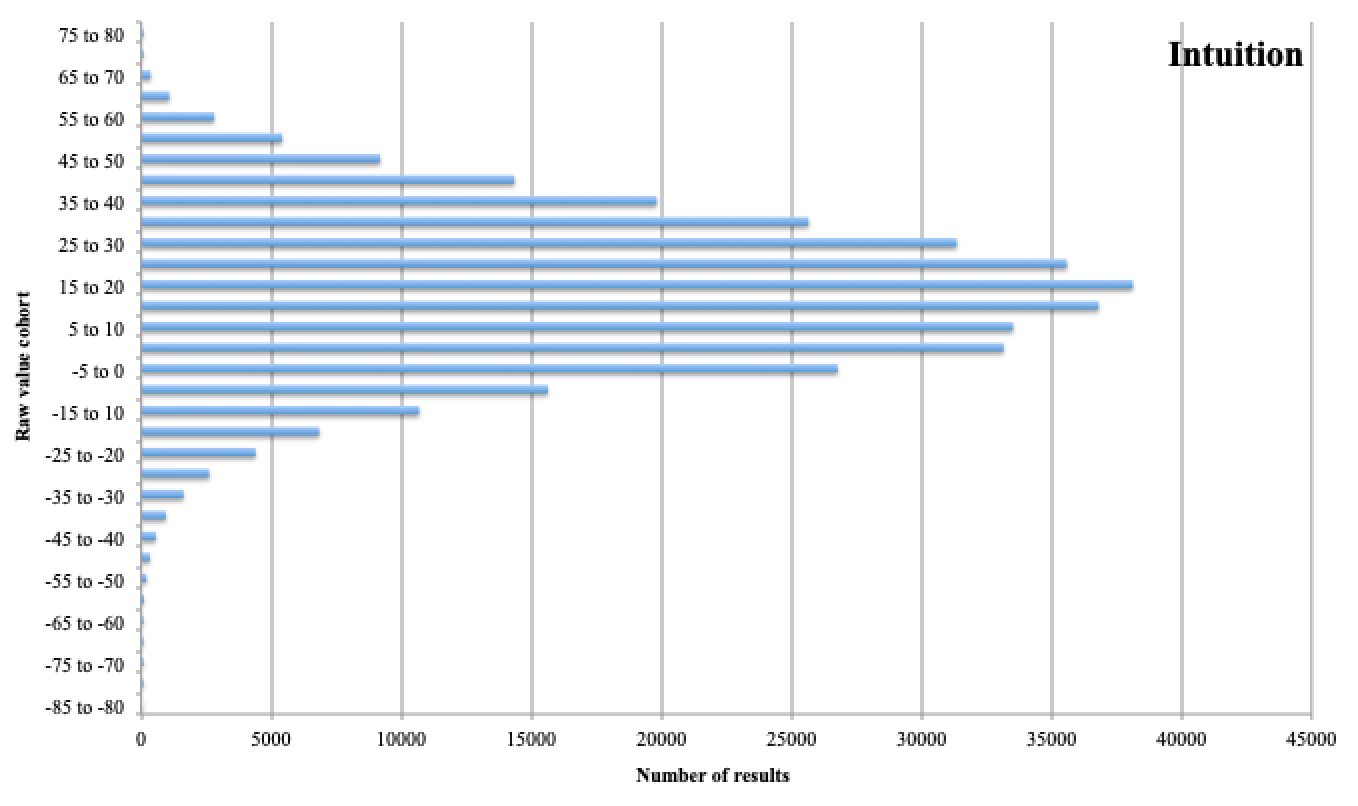
We therefore get nice bell-curve-like distributions when analyzing the new data:


However, there is still something rather interesting about these results when we look at the final type distribution:
| Type | Frequency |
|---|---|
| ENFJ | 22147 |
| ENFP | 39362 |
| ENTJ | 11041 |
| ENTP | 15007 |
| ESFJ | 38874 |
| ESFP | 13947 |
| ESTJ | 28430 |
| ESTP | 10012 |
| INFJ | 11182 |
| INFP | 24674 |
| INTJ | 23726 |
| INTP | 38475 |
| ISFJ | 11186 |
| ISFP | 7658 |
| ISTJ | 36551 |
| ISTP | 17453 |
The distribution doesn’t look even at all, does it? It might be strange seeing this at first glance, but it makes sense when we look back at the new z-score value set. It’s first worth noting that the distribution is fairly even along each of these axes, with a roughly equal amount of results ending up on both sides of the four axes. With this now in mind, we can look back at the previously shown tables and subtract the z-scores taken from the first dataset at 0 from those taken at 0 for the new dataset to conclude that a test taker will lean P (∂z=1.011), N (∂z=0.852), T (∂z=0.544) and then I (∂z=0.452) (compared to a random set).
Of course, this doesn’t mean that the average test taker is INTP. If we assume these to be the “directions” that the test is inclined toward, then types closer to the combination of I, N, T, and P should be more likely to score. INFP and ENFP seem to be very common, but ENTP lags behind. ESFJ is extremely common on the opposite end, which makes sense: the test seems to be oriented toward an INTP-ESFJ divide. ESTJ and ISTJ are very common, but ISFJ lags behind. Interestingly, ENTP and ISFJ seem to correspond as the “unexpectedly uncommon” types in these two sets. It seems as though the most difficult axis to break along the INTP-ESFJ axis is the I/E axis.
SP and NJ make up, somewhat unsurprisingly, the rarer set of letters 2 and 4. This is inherent to the test; the questions are generally scored along the sets of N and P and S and J despite my best efforts to find ways of separating them, and this will inevitably show up in the data.
The most common among these eight types is INTJ, followed closely by ENFJ. Interestingly, we observe two different axes being broken here along the INTP-ESFJ axis. INTJ breaks INTP along J/P, and ENFJ breaks ESFJ along N/S. The most common types among this uncommon set are those that strongly defy the averaged INTP test taker profile (against J/P and N/S), just as the least common among the common set are those that defy it along its weakest axis (against I/E). ISFP is the rarest result, differing along N/S and T/F for INTP and differing along I/E and J/P for ENFJ. ENTJ, differing along opposite axes, is the third-rarest type.
It may be worth pointing out that the most common result is ENFP despite this letter combination not matching where the bell curves are centered. It is hardly unusual that an EF variant of the NP profile would be the top result, especially when considering the strengths of these individual preferences not being reflected in these four-letter results.
The test could certainly be improved to allow for more differentiated scoring, but doing so would require rewriting its questions. Overall, the application of the letters has been successful given the constraints provided by the questions, but it may be worth exploring what happens when these constraints are removed altogether in a new iteration of the test. There are many ideas worth exploring, such as attributing function values arbitrarily to questions in the same fashion letter values have been to questions on this test.
More data and analysis may be released in the future. Since data is also collected for each individual question, it may be a fun idea to do a review or commentary on all the questions paired with what I can analyze from their responses.
Stay tuned!